Satellite images, or sat images, used in conjunction with grib files and weather charts help to better understand weather phenomena.
If you want to deepen your knowledge on this subject and speak French, we encourage you to read the excellent book by Jean-Yves Bernot : “Images sat - La météo vue du ciel”
Sat images will be useful for:
- follow the action centers of Highs and Lows…
- to link cloudy phenomena to variations in the surface wind field
- to specify the behavior of certain delicate zones: cold fronts, edges of anticyclones, doldrums…
- visualize local effects.
The downloadable satellite images are derived from geostationary satellite data.
- Their resolution is of the order of 1 km in the visible channel and 3 km for other channels such as infrared.
- The images and their gif animations are updated every hour on our servers.
The following processing is done for each image:
- projection in Web Mercator in order to be able to superimpose them on the application’s cartography.
- addition of the coast and border lines, a latitude/longitude grid for better readability
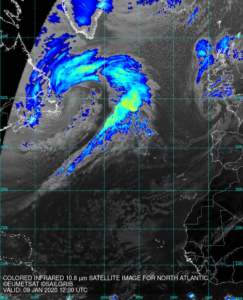
- Colorisation of the images in the infrared to highlight the clouds with the greatest vertical extent and therefore potentially the most active squalls.
- high compression to obtain images which are downloadable with an Irdium Go. The files have a size between 80 and 170 kb and are fit for the app Iridium Go direct download module.
To date, the images come from Eumetsat’s Meteosat 0° and 41.5° satellites as well as from NOAA’s GOES 16 and GOES 17 satellites. Only the region between 110°E and 160°E is not covered in the application, as the Japanese weather service does not freely distribute the images from the Himawari 8 satellite.
We produce and distribute 4 types of images:
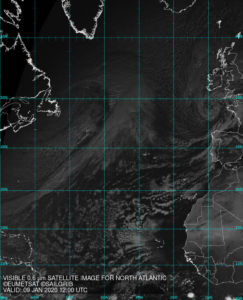
- Visible: to highlight low layer phenomena. Are only useful during the day. The sea is very dark.
- Thermal infrared: the higher the clouds are, the colder they are. Available day and night. Colorized to highlight cyclogenesis.
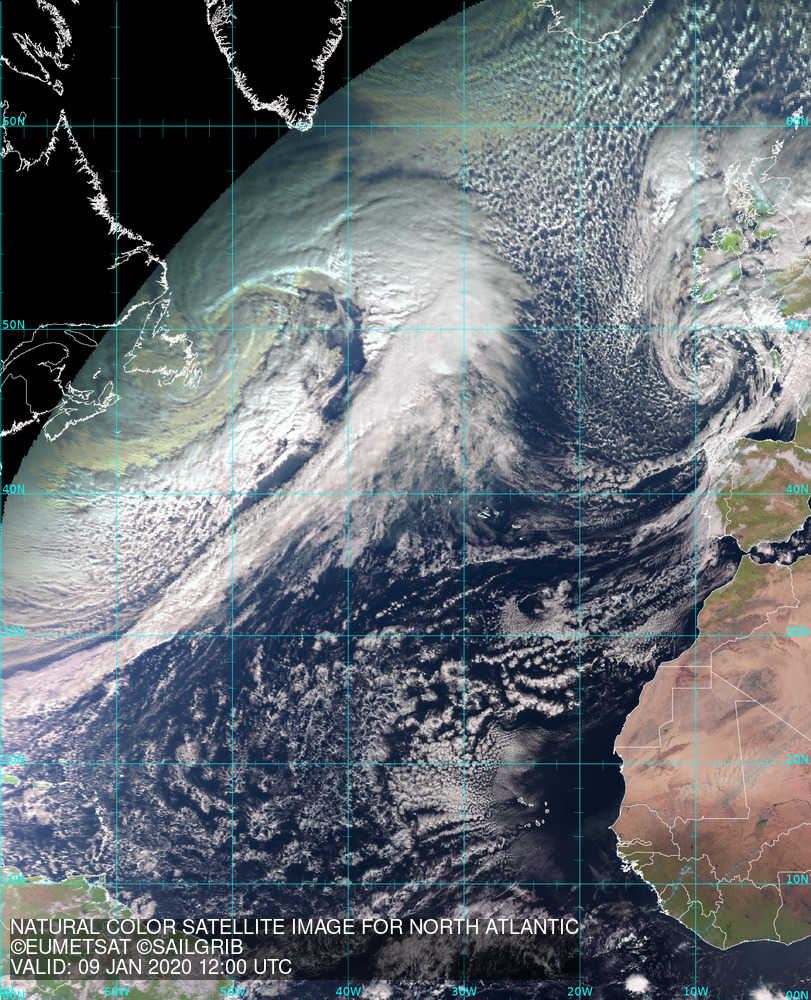
- Natural color: combined from several channels. Eumetsat only.
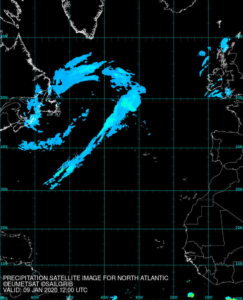
- Precipitation: combined from several channels, gives a snapshot of precipitation, the result is very similar to precipitation radar images. This processing has recently been added by Eumetsat.
In addition, you can also get the Sargassum sat image for the tropical North Atlantic. The image comes from a satellite in low orbit, it gives the concentration of Sargassum. To be used with the notion of slow areas for routing in the app.
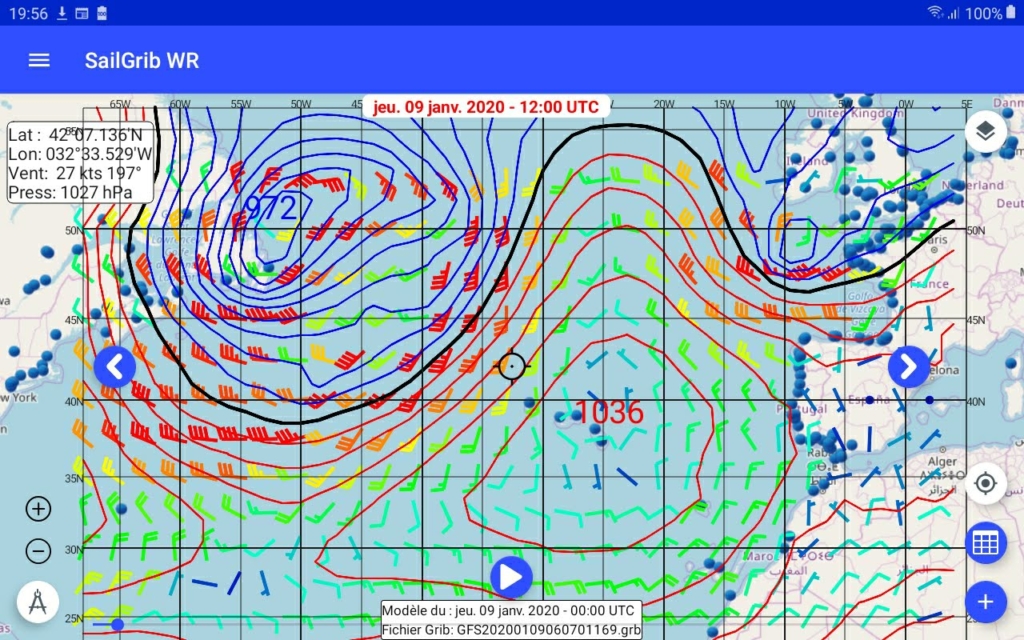
Here are 4 images of the North Atlantic for January 9, 2020 at 12:00TU.
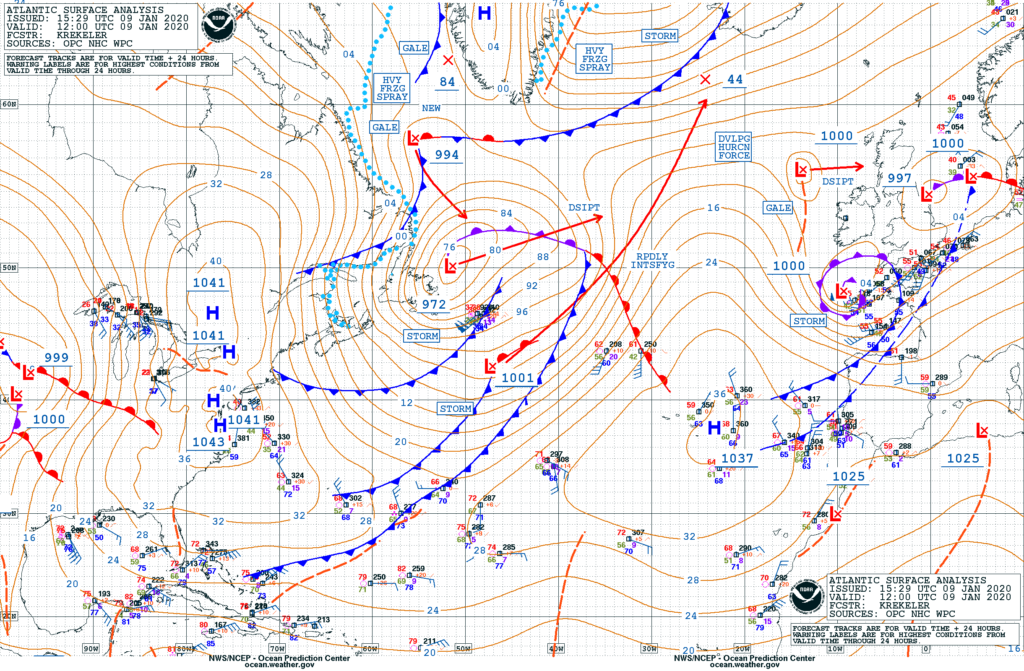
The corresponding surface analysis map.
And the grib file from the GFS model