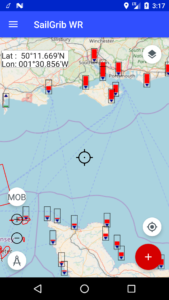
You can visualize on a map the tides in the different ports of a coast, which should give you a good idea of the tidal wave. Here are for example the water levels in the different harbors of the Channel on 04 April 2018 at 3:17PM. In red the tide is ebbing, in green it is rising.