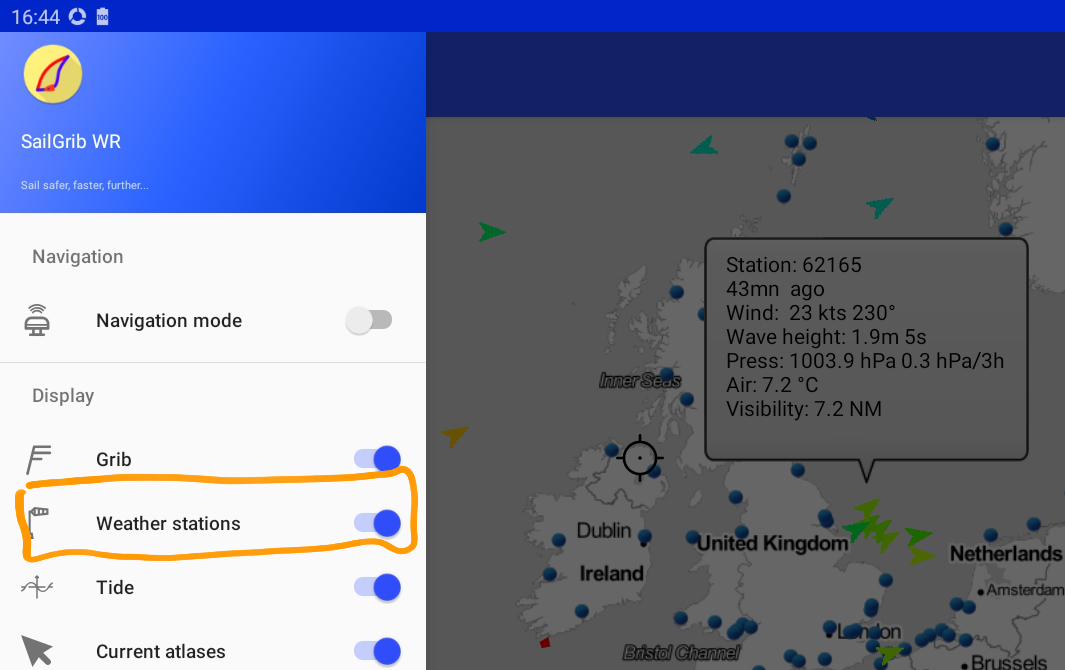
Open the main menu
Check “Weather stations”
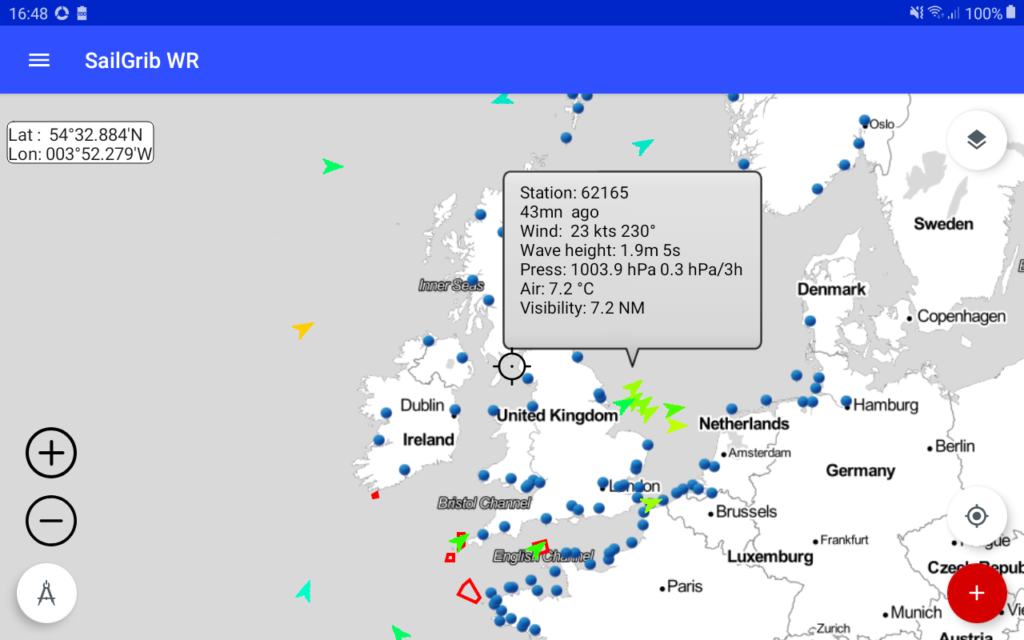
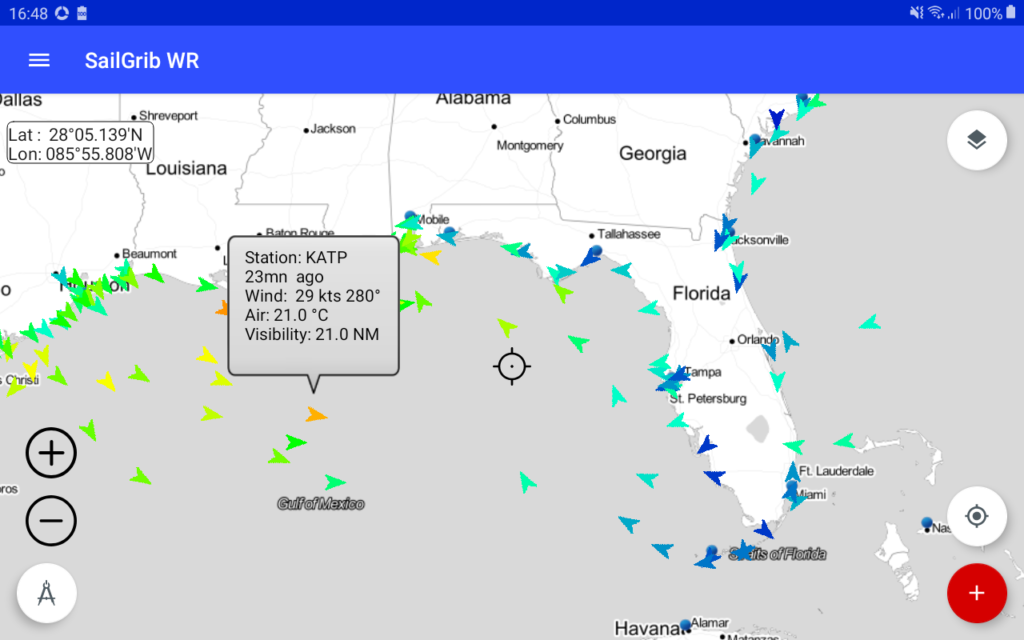
Data are automatically downloaded and displayed as arrows.
The color of the arrows depends on the wind speed. The gradient is the same as the one used to display the grib files wind barbs.Tap on a station to view the details of the reading.